



Case study · Amazon seller
Nocqua Adventure Gear: revenue 4.5x in three months
Nocqua came to us in November 2025 for listing work. Their ads had no clear structure and spent heavily without matching returns, so from January 2026 we rebuilt the account.
- Amazon PPC
- Listing SEO
- Images & A+
Real account data
Amazon sellerNocqua Adventure GearOutdoor gear brand · Amazon US
- Monthly revenue
$25,929$117,112 - Units a month
195893 - ACoS
29.09%10.09% - TACoS
13.49%5.18%
Results at a glance
December 2025 (before the rebuild) against March 2026.
Monthly revenue
$117,112.17from $25,929.06
Units ordered
893from 195
Ad sales
$60,115.77from $12,024.59
ACoS
10.09%from 29.09%
TACoS
5.18%from 13.49%
The starting point
Where the account started
- Branded and non-branded keywords sat in the same ad groups, so neither could be judged on its own.
- Many search terms and match types were getting clicks with no sales.
- Budget was spread with no clear priority, so ad spend was high for what it returned.
- Nothing protected the brand's own searches from competitors' ads.
The work
What we did
Rebuilt the campaigns
- Restructured the whole account to stop wasted spend and get control of budgets.
- Split branded and non-branded keywords into their own campaigns, each with its own budget.
- Removed the search terms and match types that clicked without selling, and moved that budget to proven terms.
Launched new campaigns
- Competitor campaigns to win extra market share.
- Dedicated campaigns for the top keywords and ASINs.
- Defensive campaigns so competitors could not take the brand's own searches.
Improved the listings
- Updated product images, A+ content (EBC) and the storefront to lift conversion.
The numbers, period by period
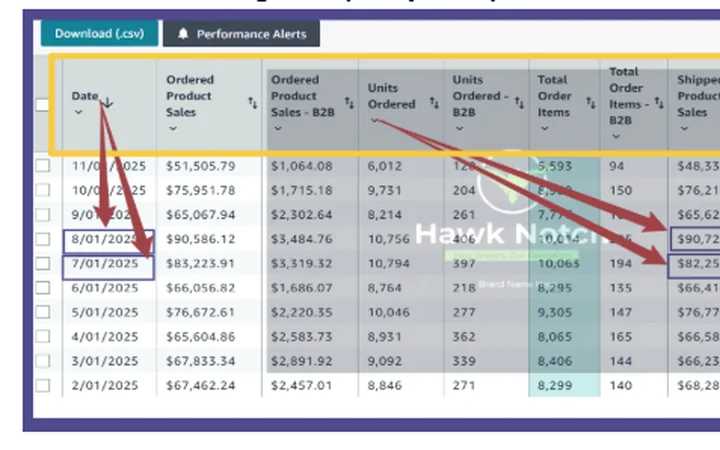
Copied from the account's own reports. Every row matches a screenshot below or the client's report.
| Month | Units | Revenue | Ad spend | Ad sales | ACoS | TACoS |
|---|---|---|---|---|---|---|
| Dec 2025 | 195 | $25,929.06 | $3,497.66 | $12,024.59 | 29.09% | 13.49% |
| Jan 2026 | 361 | $45,338.88 | $3,374.63 | $20,125.32 | 16.77% | 7.44% |
| Feb 2026 | 491 | $66,598.81 | $4,889.59 | $34,963.90 | 13.98% | 7.34% |
| Mar 2026 | 893 | $117,112.17 | $6,063.49 | $60,115.77 | 10.09% | 5.18% |
The proof: screenshots from the account
Taken from Amazon Seller Central and Amazon Ads. Select any screenshot to see it full size.
More client results
See all case studies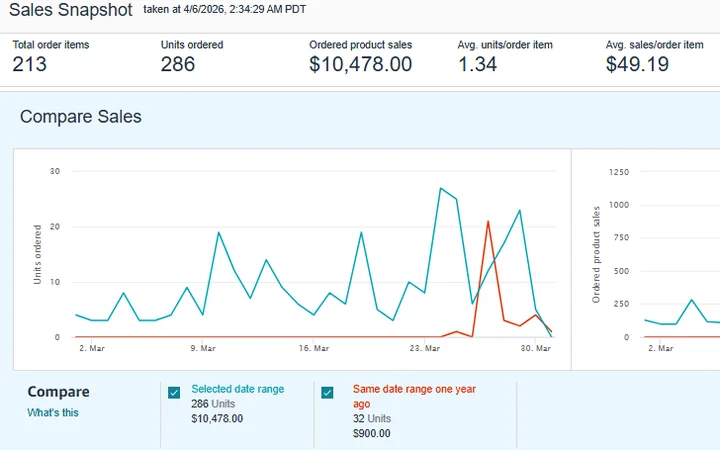
A dormant catalog from 3 units a month to 286
Units a month3286
Listing optimization · Amazon PPC launch

Prime Day sales up 94% on the same dates a year earlier
Prime Day sales$2,715$5,277
Amazon PPC · Listing images · A+ & Brand Story
Want results like these on your account?
A call where we look at your account together and show you what's holding it back.
- Search terms and campaigns that spend without selling
- Listing copy, images and A+ content against your top competitors
- The three changes we would make first, with the numbers behind them
